
See how a page really gets used
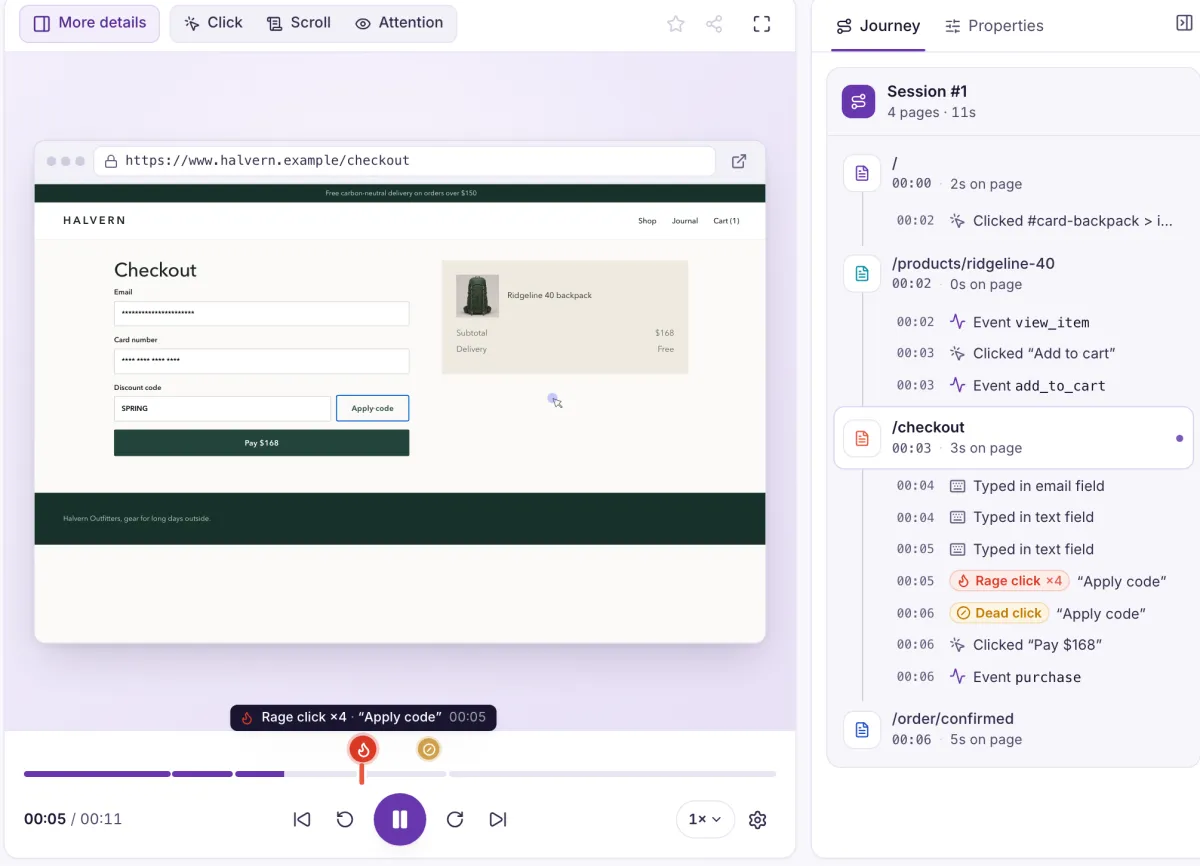
Watch visits to see the behaviour, and use heatmaps to see how many people share it.
Drag across the page
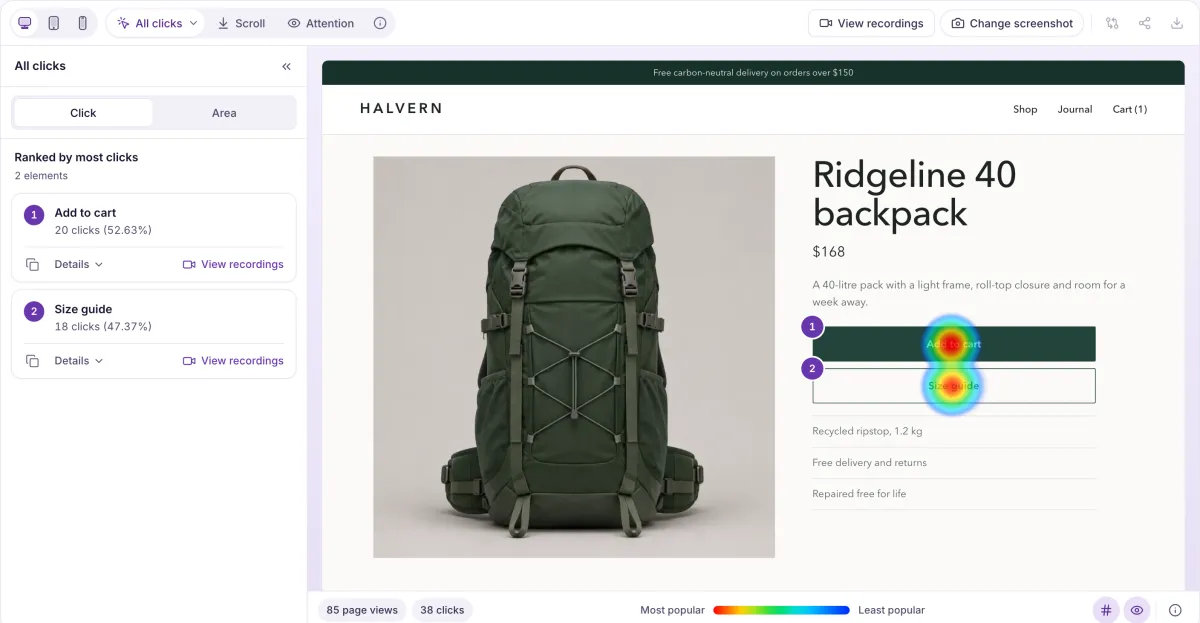
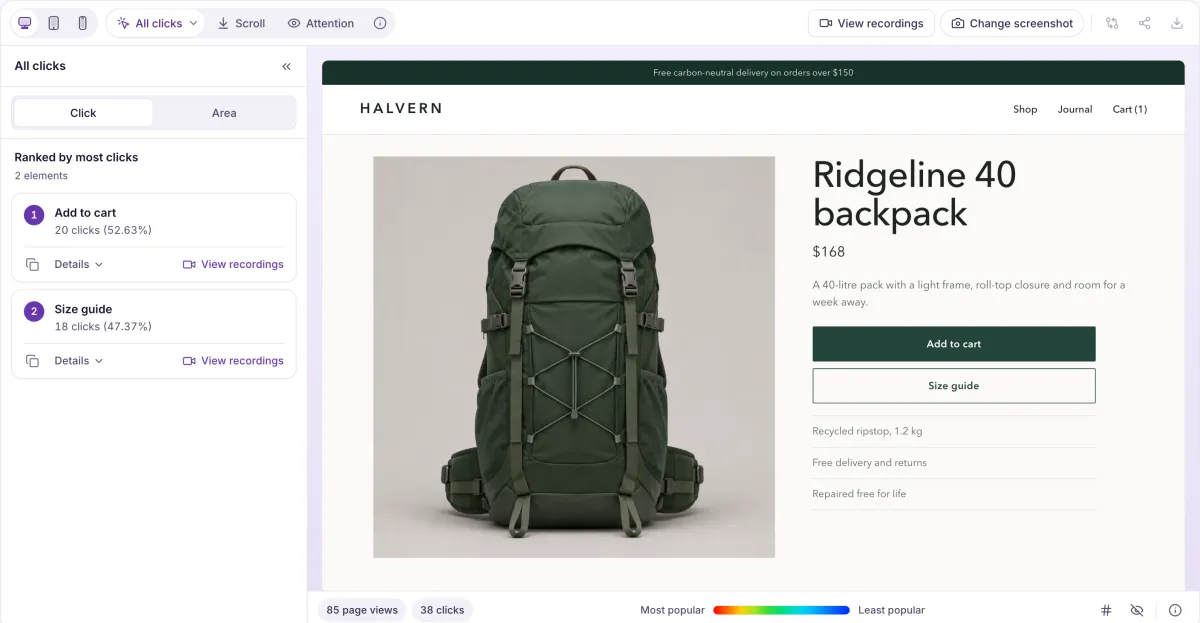
One replay gives you a theory. The map tells you whether to believe it. Same page, same snapshot, with and without everyone’s clicks.
Watch real visits
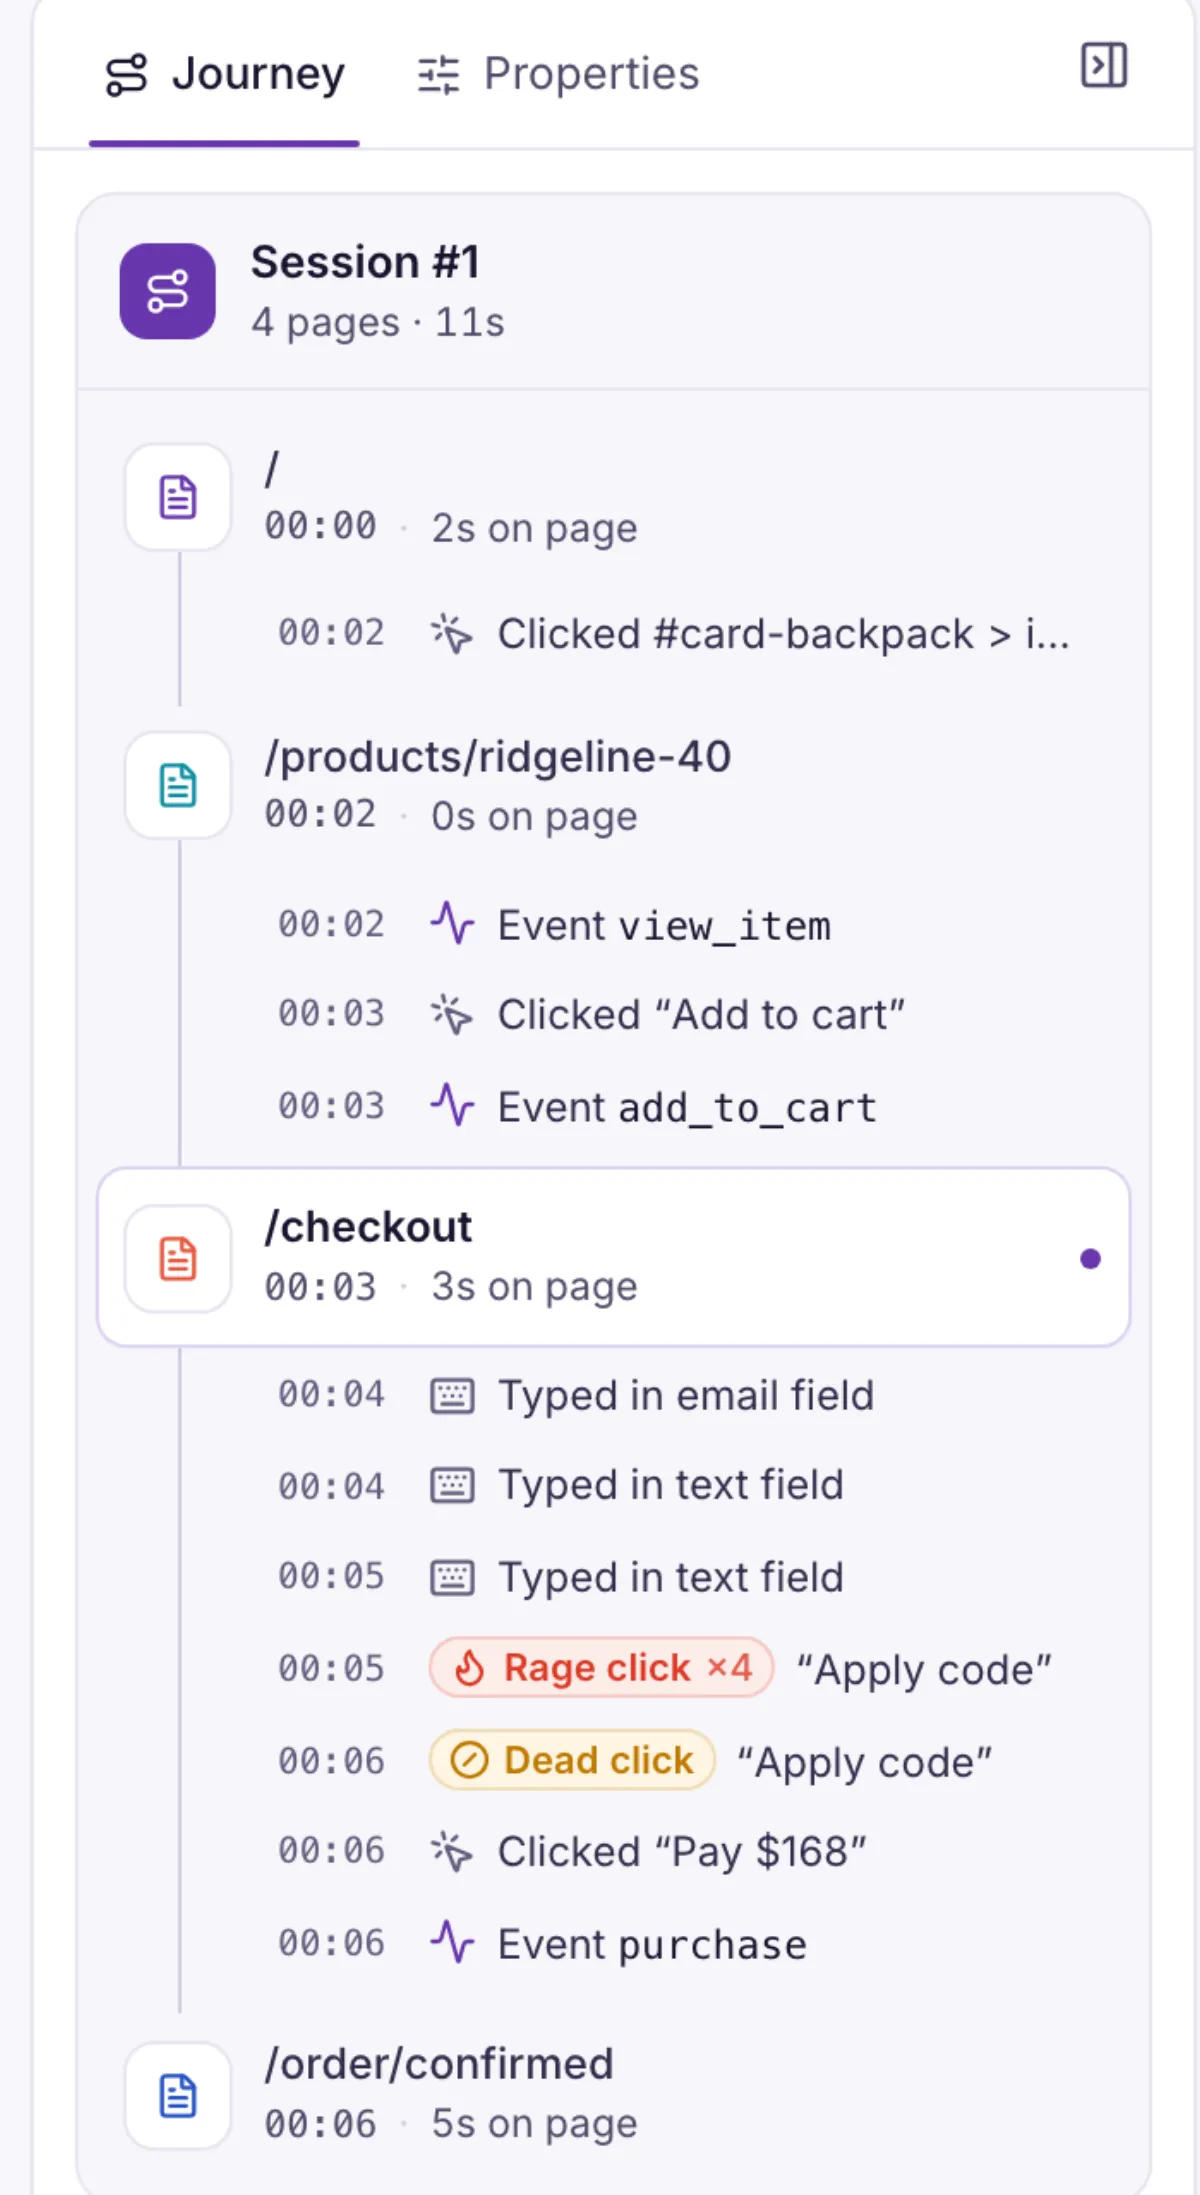
Replay a session with its pages, clicks and scrolling on one timeline. Session replay
- See clicks, scroll and attention
- Lay them over a snapshot of the page, one device at a time. Heatmaps
- Find what doesn’t respond
- Dead clicks and rage clicks show which elements people expect to work. Frustration signals
- Compare groups of visitors
- Filter any view by device, country, behaviour or the events people sent. Filters and segments
Which page is up for a redesign?
Bring it to the demo, and we’ll look at how you’d study it before you change it.