
Can I answer the next question myself?
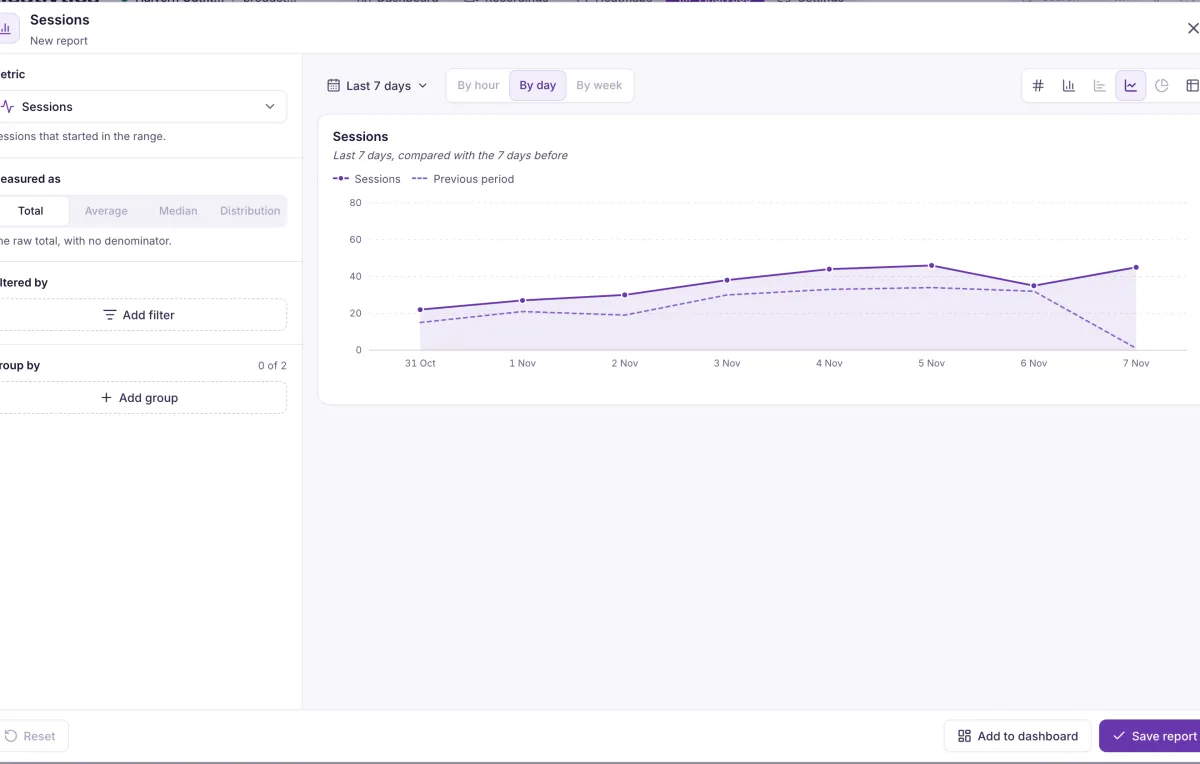
Pick a metric, how to measure it and how to group it. Every chart runs on the same data as the rest of the product, and every number leads back to the recordings behind it.
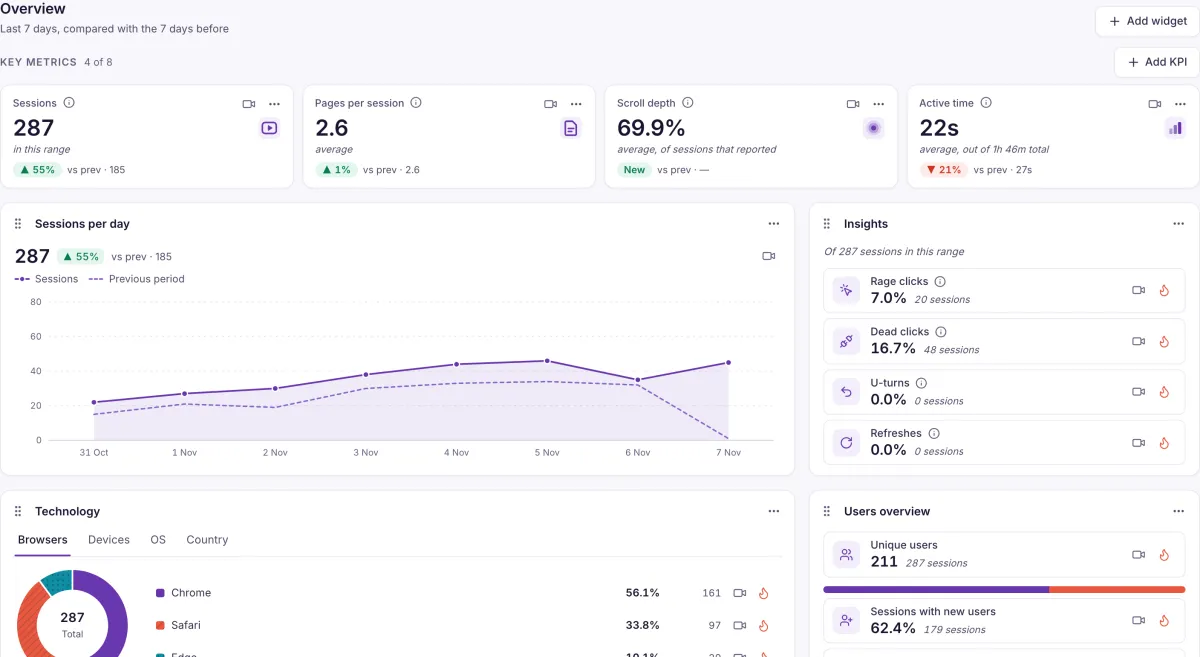
Draw the answer the way it reads best
Six chart types, with up to two group-bys. These are drawn for this page; yours run on your own data.
- 287Up on the previous periodKPI
- Column
- Bar
- Line, with the previous period dashed
- Donut
- //shop/checkoutTable
- Six chart types
- KPI, column, bar, line, donut and table, with up to two group-bys.
- Always a comparison
- Each metric is compared with the previous period, so a number comes with its direction.
- A home screen of your own
- Four KPI tiles by default, up to eight, with your own widget order. Every row links to its recordings and heatmap.
Pick a metric, then keep the answer
The builder takes a metric, how to measure it, filters and up to two group-bys. What you make can sit on a board your team opens.
- Metrics across the product
- Engagement, events, pages, users and frustration, measured as a total, average, median or distribution where each makes sense.
- From a card to the builder
- Open any built-in card in the report builder and change what it shows.
- Dashboards
- Drag and resize cards, set one date range for the whole board, duplicate it or delete it.
What it doesn’t do yet. Retention reports, public dashboard links and chart downloads aren’t available yet.
Which number do you check every Monday?
Tell us, and we’ll show you the report and the recordings behind it.