
Where are people getting stuck?
Nobody has time to watch every recording. Heatlytics flags the moments people got stuck, so you can start from the visits and the pages that went wrong.
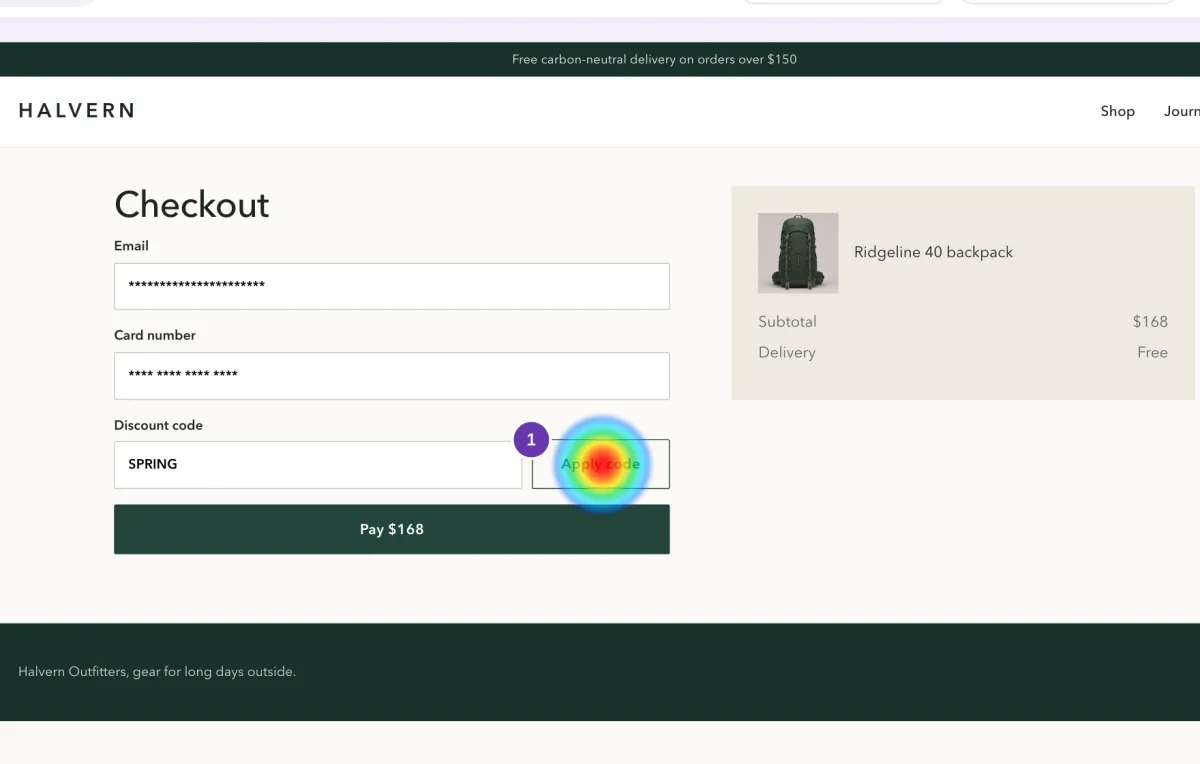
What counts as stuck, exactly
These are the default rules. They run in the visitor’s browser, and each one lands on the replay as a marker.
- Rage click
- Three or more clicks in the same spot, less than 300 ms apart.
- Dead click
- A click after which nothing on the page changes for a second.
- U-turn
- Leaving a page and coming back to the previous one within 10 seconds.
- Quick exit
- Leaving the site less than 3 seconds after a page opens.
- Reload loop
- Reloading the same page again and again.
- On the timeline
- Each signal is a marker on the replay timeline, so you can jump straight to it.
- On every session
- Friction tags on each session show which visits ran into trouble.
- On every user
- The user list shows the signals each person has hit.
Then see which pages it happens on
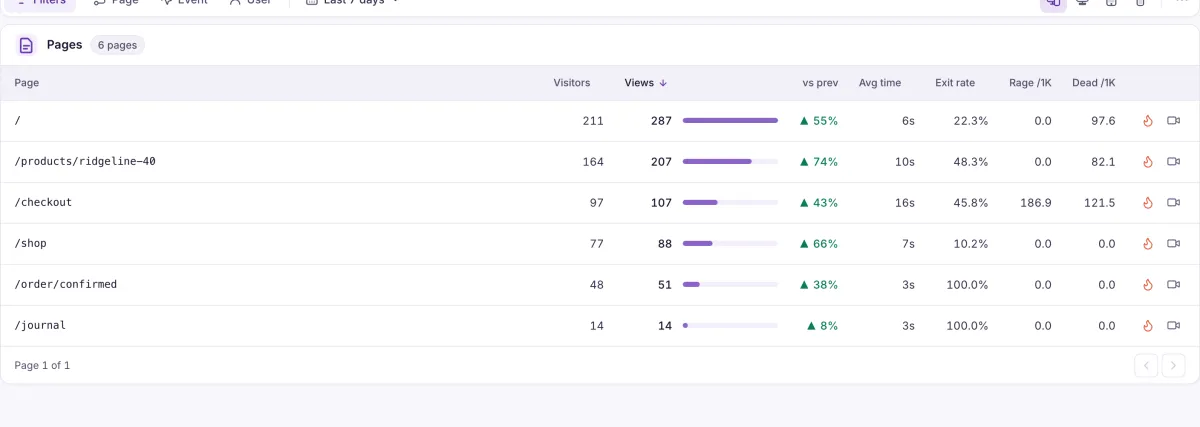
The Pages list puts dead and rage clicks per 1,000 next to exit rate, each with its change on the previous period. That’s a to-do list.
- On every page
- Dead and rage clicks per 1,000, exit rate, reload loops and quick exits, each with its change on the previous period.
- Before and after
- A page’s detail view shows where visitors came from and where they went next, as percentages.
What it doesn’t do yet. JavaScript errors and failed network requests aren’t captured yet.
Find out where your visitors get stuck
Tell us about your site, and we’ll show you how these signals read on a real journey.