
What does a page get from everyone at once?
Enter a URL or pick a popular page, and Heatlytics lays clicks, scroll depth and attention over a snapshot of that page, rebuilt from your own recordings.
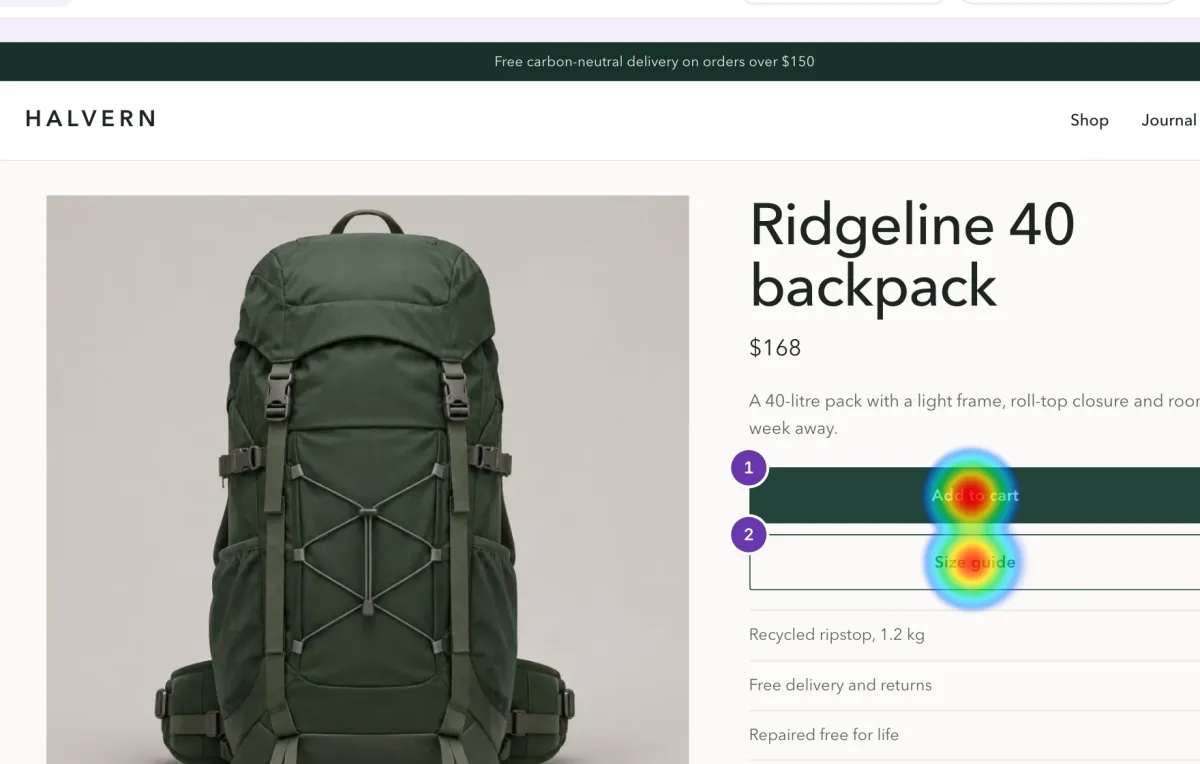
One page, three questions
Switch the view and the same snapshot answers something else.
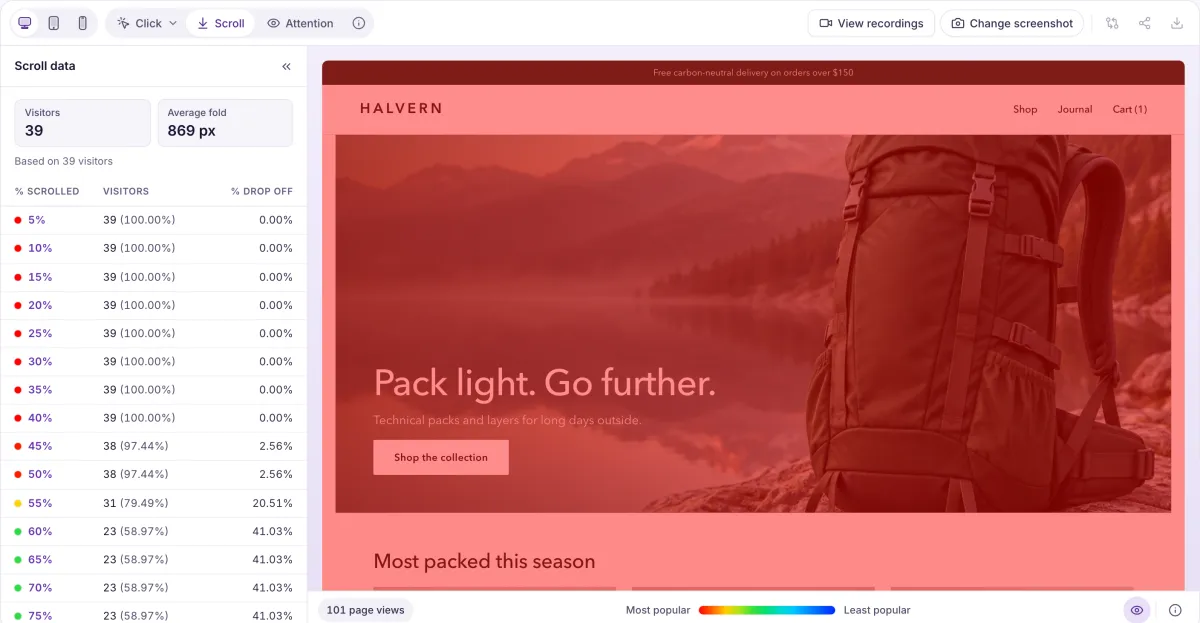
How far did people get? The bands and the table show the share of visitors reaching each depth.
- Clicks, with the rage and dead ones separated
- Switch between all clicks, rage clicks and dead clicks on the same page.
- Scroll reach
- See what share of visitors reached each depth of the page, with the fold marked.
- Attention
- See where visible time goes down the page. Idle stretches over 30 seconds are not counted.
- One device at a time
- Switch between desktop, tablet and phone, and pick a page snapshot by date.
- A warning when the sample is thin
- A page with fewer than 10 views says so, so you don’t redesign around a handful of visits.
Then read it as a list
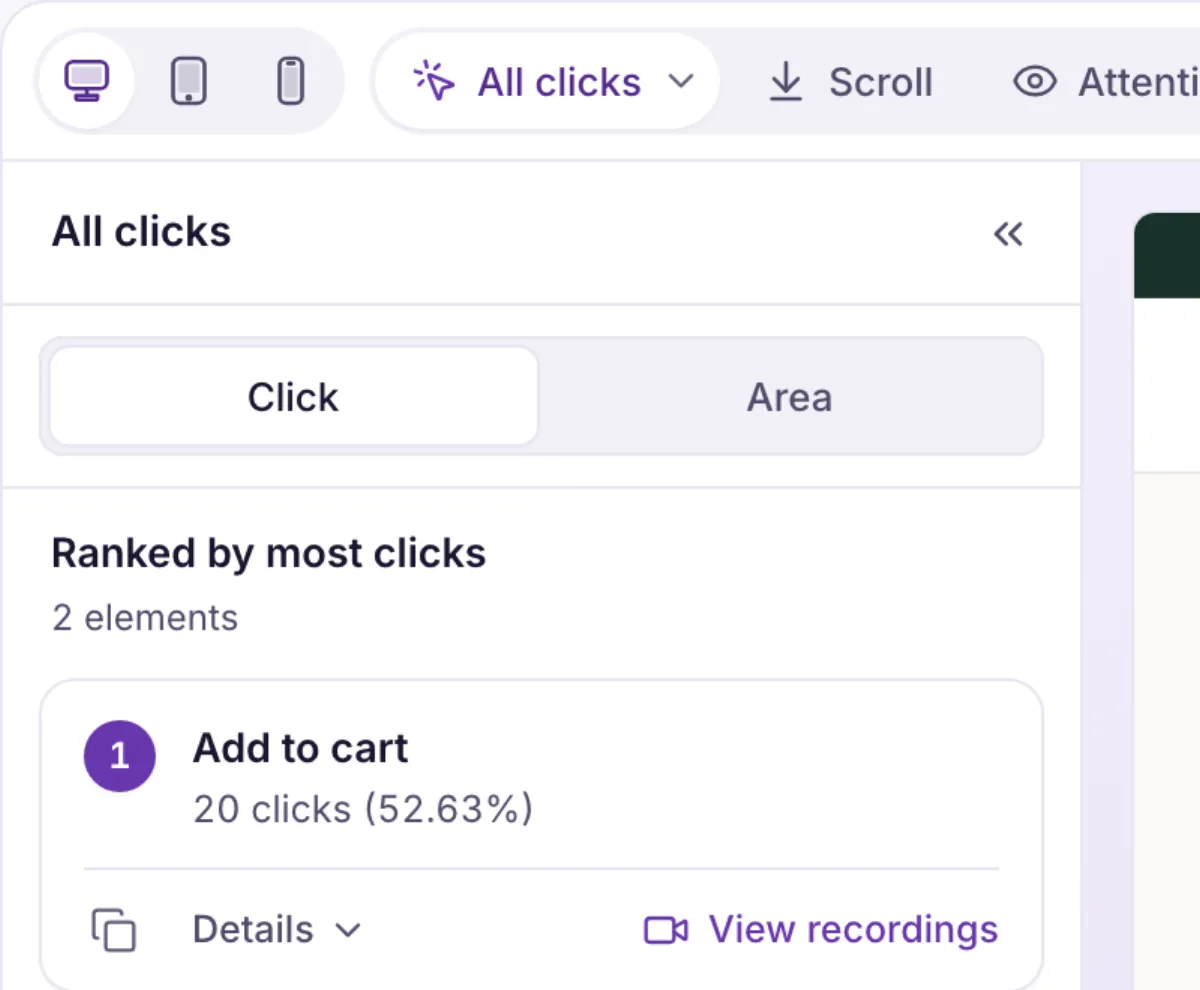
The panel beside the map ranks what got touched, so you can argue from numbers instead of from how red a spot looks.
- Elements ranked by activity
- For each element: click rate, how often people click it again, how often it fails to respond, and how many rage clicks it draws.
- Areas
- Group the page into areas and compare them. The header, navigation and footer are always their own area.
- From the map to the recordings
- Open the recordings behind any element. The Click, Scroll and Attention buttons in the player go the other way.
What it doesn’t do yet. Comparing two date ranges isn’t available yet. Snapshots come from stored recordings, so a date older than your replay retention has no picture.
See your busiest page as a heatmap
Bring a page you’ve been arguing about. We’ll show you how Heatlytics would read it.