
See what people do with what you shipped
Measure a path through your product, then watch the sessions behind the numbers before you decide what to change.
The week after a release
Where do they stop?
Measure a path
Build a funnel from pages and events, and see conversion, drop-off and time to convert.
Funnels and flows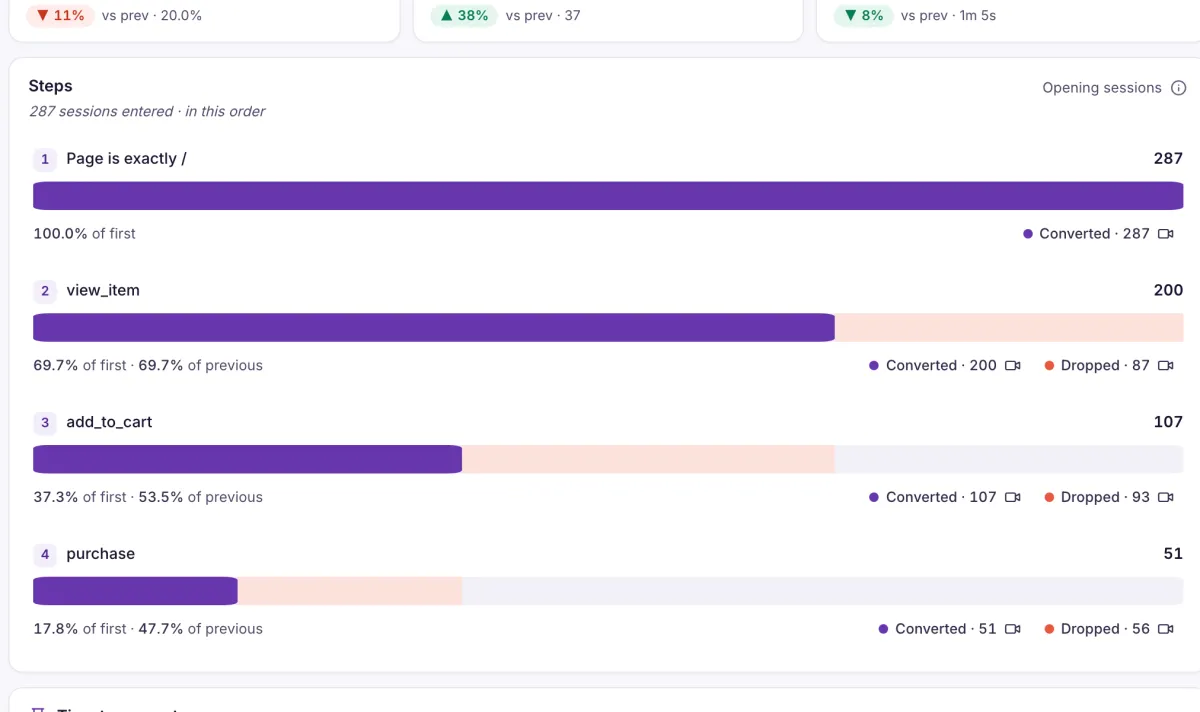
Did they go the way we drew it?
See the real routes
Flows show the routes people take between pages, including where they quit.
Funnels and flows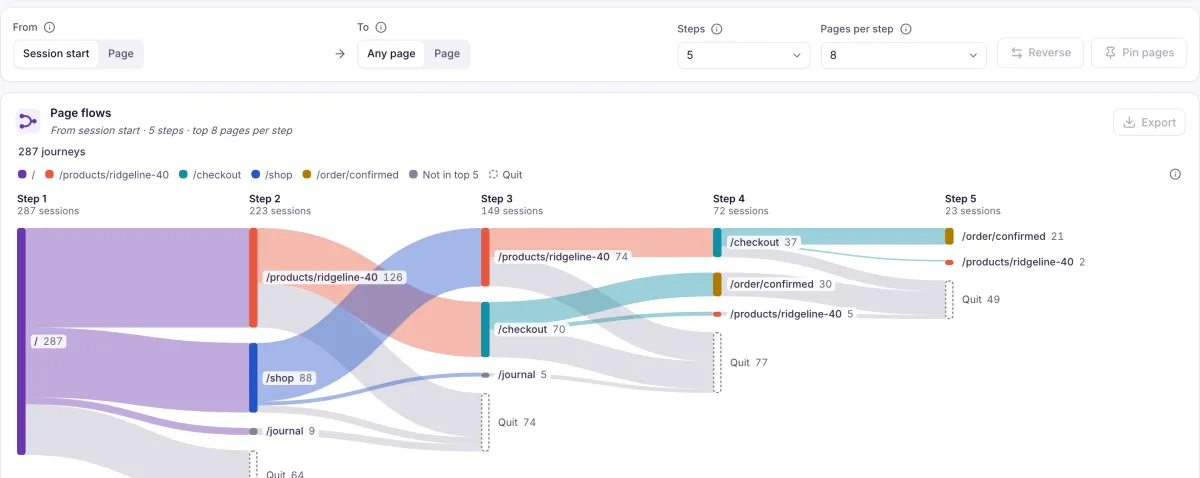
Do they come back to it?
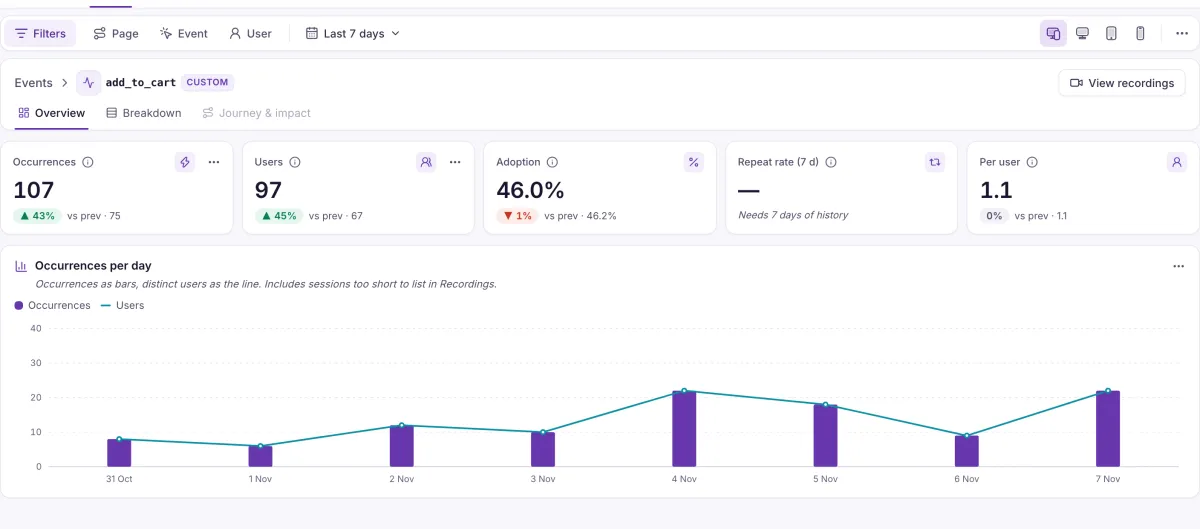
Track your own events
Send custom events with properties, then see adoption, repeat rate and breakdowns.
Users and eventsheatlytics.event('export_started', { format: 'pdf' }) // Then, under Analytics, Events: // occurrences, users, adoption, repeat rateCan the whole team see this?
Keep the numbers together
Build reports and put them on a dashboard the team can open.
Reports and dashboards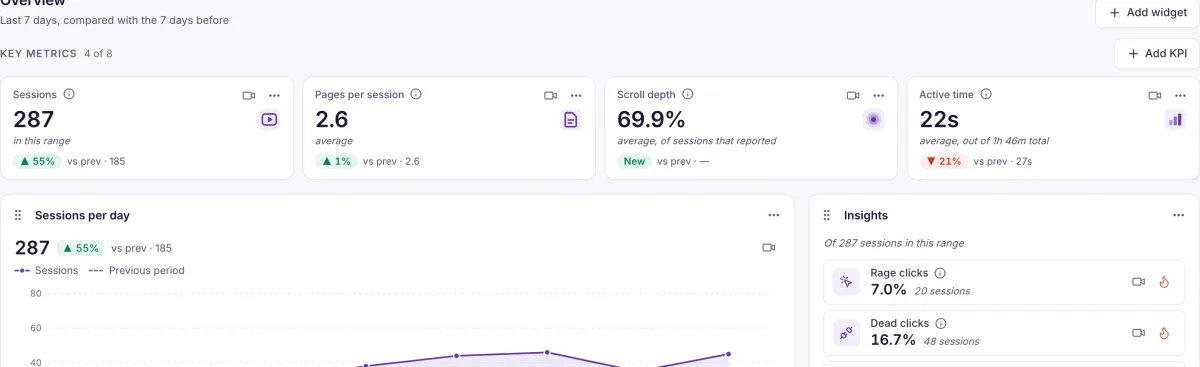
Then you ship the fix, and the same funnel, on the same events, tells you whether it worked.
What did you ship last?
Tell us, and we’ll show you how you’d measure it and who to watch.